PREDICTING FUEL
ECONOMY
PREDICTING FUEL ECONOMY
PREDICTING
FUEL ECONOMY
GOODNESS OF
MODEL
GOODNESS OF
MODEL
SIMPLE REGRESSION MODEL FIT
Simple linear regression quantifies the relationship between two variables by producing an equation for a straight line of the form y = a + bx which uses the independent variable (x) to predict the dependent variable (y).
The aim is to establish a mathematical formula between the the response variable (Y) and the predictor variables (X)
We can use this formula to predict Y, when only X values are known.
Regression involves estimating the values of the gradient (b )and intercept (a) of the line that best fits the data .
This is defined as the line which minimises the sum of the squared residuals.
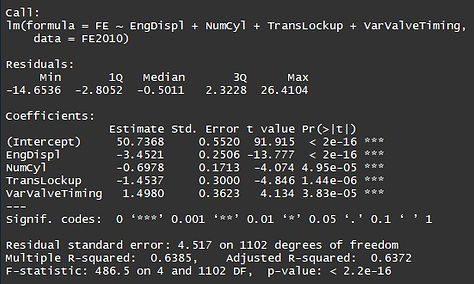
First building simple regression model while taking all variables,using Fuel Economy as our main response variable
As this full model contains all variables as predictors,
we see some variables which are not that much useful or significant in terms therefore leaving out that variables,also the summary of model stats that the variables engine displacement,number of cylinders,transmission lockup,variable valve timing
are statistically significant as they are having P-values <0.05 ,as model having less predictor is quite more accurate in prediction than model with all variables as predictors,therefore we go for further variable selection and processing while leaving out some variables.

Lets build another Simple regression model by taking those 4 predictors only
As this model contains left out variables as predictors,
we see all the variables engine displacement,number of cylinders,transmission lockup,variable valve timing are
statistically significant as they are having P-values <0.05 .We see multiple R squared value of model which is the accuracy as 64% (approx).
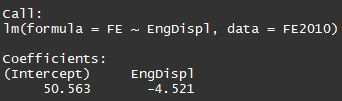
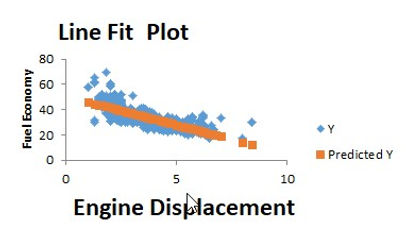
Building our main simple regression model while taking Engine Displacement as predictor,
using Fuel Economy as our main response variable.


Now after going over with various model and different predictors while keeping in mind
there significant statistical impact and p values,also
using variable selection and thus finally come down
to this using Engine Displacement variable as our main predictor.
This is our final logistic regression model.
We have used Engine Displacement as our predictor due to there higher impact on FE and also as there p values is less
than 0.05,hence making them statistical significant.
That is engine displacement as a function for FE we can notice that 'Coefficients' part having two components:
Intercept:50.563, speed: -4.521
These are also called the beta coefficients.
y=b0 + b1x
FE=50.563-4.521 × engine displacement
By building the linear regression model, we have
established the relationship between the predictor and
response in the form of a mathematical formula.

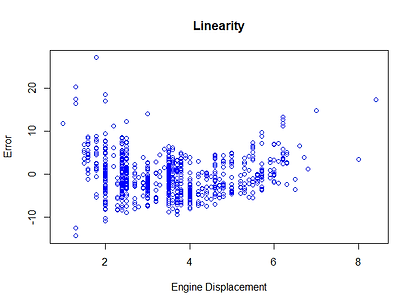
ASSUMPTIONS OF MODEL
Assumptions of the linear regression model and test
Normality
Linearity
Independence of error
Constant error variance


SELECTING BEST PREDICTOR
&
PREDICTING FUEL ECONOMY
Finding the best input variable for predicting FE using suitable statistical test thus for that we are using Correlation.
A measure used to represent how strongly two random variables are related is known as correlation.
Correlation refers to the scaled form of covariance.The value of correlation takes
place between -1 and +1. It is not influenced by the change in scale.
Correlation Coefficient of two variables in a data set equals to their covariance divided by the product of their individual standard deviations. It is a normalized measurement of how the two are linearly related.If the correlation coefficient is close
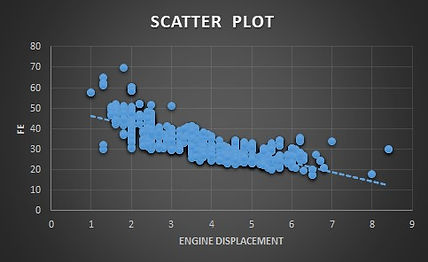
to 1, it would indicate that the variables are positively linearly related and the scatter plot falls almost along a straight line
with positive slope. For -1, it indicates that the variables are negatively linearly related and the scatter plot almost falls along
a straight line with negative slope. For 0, it would indicate a weak linear relationship between the variables.
Correlation is dimensionless, i.e. it is a unit-free measure of the relationship between variables.
We will find correlation of all variables with respect to Fuel Economy

For Example finding correlation between FE and engine displacement we will be using this R code.

Engine Displacement is the best Predictor
since it got the highest correlation,therefore we have used this in final model.
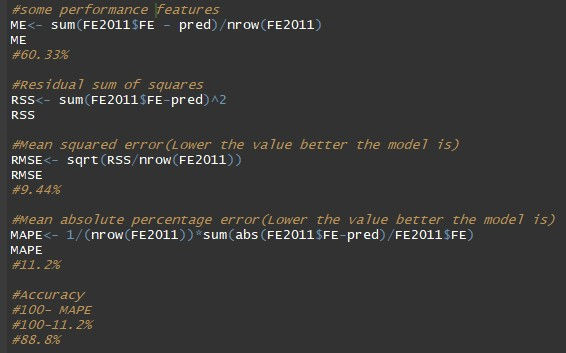
Making Prediction
We make Prediction on the final model using test FE2011 data

GOODNESS OF MODEL
T-statistics (-42.46),Std Error of regression coefficient (0.1065) and Probability (of committing Type I Error) is < 2e-16 almost 0]
are associated with a t-test which tests following Null Hypothesis:
Ho: The slope of fuel economy with engine displacement is not significant
Ha: The slope of fuel economy with engine displacement is significant
In mathematical symbols:
Ho:B1 =0(there is no linear relationship)
Ha:B1 !=0(there is linear relationship)
Now let's discuss about Pr(>|t|) or Probability value (Significance value)
Here the rule goes like this:
If, p value is <,= 0.05 (for 5% Level of Significance) REJECT Ho
If, p value is > 0.05 (for 5% Level of Significance) ACCEPT Ho
MULTIPLE R-SQUARED
As the model variable p value is 0 which is less than 0.05,we REJECT the Ho (and ACCEPT Ha) and
conclude that "Slope is significant"
Multiple R- squared 0.62 by this we understand that
62% of the variance in FE can be explained by Engine displacement
[Remaining 38% is unexplained variance....due to factors outside the model].
Accuracy of the model is 62%
F-STATISTIC
F-statistics 1803 on 1 and 1105 DF, p-value: <2.2e-16
The higher the F-Statistic the better fit the model will be all about goodness of fit
Ho:Model is not good
Ha:Model is good
As p-value (Significance value) is <2.2e-16
which is nothing but 0, we reject the null hypothesis
and conclude that the model is statistically a good fit model
Performance Features of the Model