DESCRIPTIVE & INFERENCIAL ANALYTICS

TESTS
CHI-SQUARE TEST
T-TEST

The above t test table is used for finding out the factors or variables which are affecting churn.
If we see the variable having p value less
than 0.05 then they are significant and
affecting,on the other hand if the variables
having p value greater than 0.05 then
they are not significant,hence
being dropped from the dataset.
Now since in our dataset all
variables are having p value less than
0.05 so affecting in small or big way to churn,
therefore we will not remove any variable
till now and go for further analysis.
Independent Sample T-Test
To check influence of numerical variables on churn
Churn variable is binomial that is categorical
other variables are continous

Overall defining the null hypothesis
Ha: Mean of our continous variable is
not same across churn levels
Ho: Mean of our continous variable is
same across churn levels
What We Infer
Chi Square Test
To check influence of categorical variables on churn
Churn variable is binomial that is categorical
other variables are categorical
Overall defining the null hypothesis
Ho: There is no association between our churn variable and other categorical variables respectively
Ha: There is association between our
churn variable and other categorical variables respectively
What We Infer
The above chi Square test is done to find the association between churn with other
categorical variables, hence we are
finding which categorical variables
are affecting churn.So on the basis of
p value we will drop down the variables
which are having p values greater
than 0.05.
Now since in our dataset both
international plan and voice mail plan
variables are having p values less than 0.05,hence they are having association with churn therefore we are not removing them from our dataset.

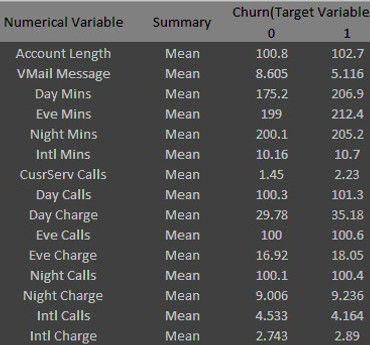
SUMMARY OF NUMERICAL VARIABLES

The average account length of customer
is between 100 to 102.
The average number of voice mail message sent by customer
is between 5 to 8.
On an average the total day minutes of customer
is between 175 to 206.
On an average the total night minutes of customer
is between 200 to 205.
On an average the total evening minutes of customer
is between 199 to 212.
On an average the total international minutes of customer
is 10 (approx).
On an average the number of customer calls done by customer
is between 1 to 2.
On an average the number of day calls of customer
is between 100 to 101.
On an average the total day charge of customer
is between 29 to 35.
On an average the number of evening calls of customer
is 100 (approx).
On an average the total evening charge of customer
is between 16 to 18.
On an average the number of night calls of customer
is 100 (approx).
The average total night charge of customer
is 9 (approx).
The average number of international calls of customer
is 4 (approx).
The average total international charge of customer
is 2.8 (approx).
INFER FROM PLOTS

From this plot we analyze that the following variables are highly correlated and associated with each other.
Correlated variables