PREDICTING PROBABILITY OF CHURN
GOODNESS OF
MODEL
GOODNESS OF
MODEL
LOGISTIC REGRESSION MODEL FIT
Creation of Training and Test Logistic Regression
Splitting our main response variable Churn into a ratio of 80:20
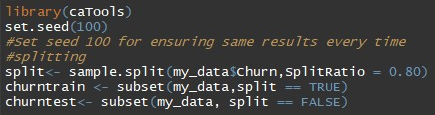
First building logistic regression model while taking all variables,using churn as our main response variable

As this full model contains all variables as predictors,
there may be some variables which are not that much useful or significant in terms and just taking extra place in our model or may be they are affecting our model in some ways thus processing
is required,as model having less predictor is quite more accurate in prediction than model with all variables as predictors,therefore we go for further variable selection and processing.
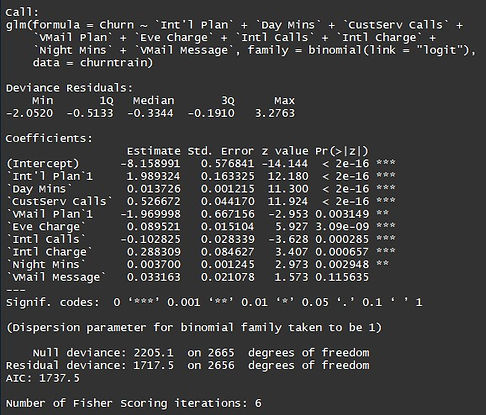
Building our main logistic regression model while taking some variables as predictors,
using churn as our main response variable.

Now after going over with various key and combinations
of predictors in our main model while keeping in mind
there significant statistical impact and p values,also
using variable selection and thus finally come down
to this using this variables as our predictors.
This is our final logistic regression model.
We have used international plan,day minutes,customer service calls,voice mail plan,evening charge,international calls,international charge,night minutes,voice mail
message etc,this as our predictors due to there higher
impact on churn and also as there p values is less
than 0.05,hence they are statistical significant.
MODEL VALIDATION
To control the model from overfitting we used cross validaton method

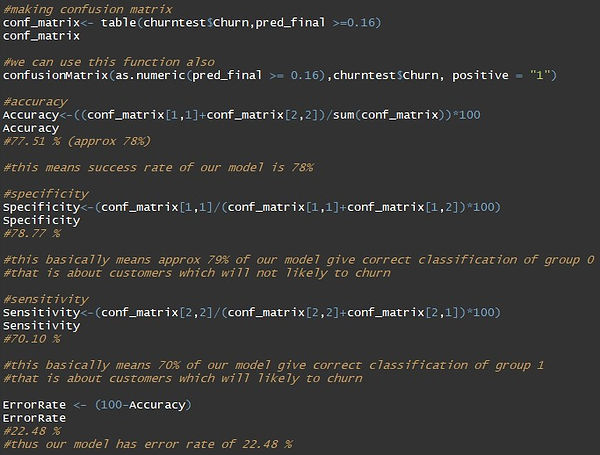
THRESHOLD SELECTION & PREDICTION
Function was written to find the accuracy for different threshold probabilities.It was observed that although accuracy and specificity increases with threshold limits of following when we go looking in this manner [>=0.1],[>=0.15],[>=0.16],[>=0.2],[>=0.3],[>=0.4] but its sensitivity on other hand also started decreasing with that Hence we tested for different probabilities of [>=0.1],[>=0.15],[>=0.16],[>=0.2],[>=0.3],[>=0.4]out of which I go with threshold probability of [>=0.16] by keeping in mind all other measures values of specificity,sensitivity and accuracy etc,as we know accuracy
is main criteria but we can't ignore specificity and sensitivity as well here for our churn prediction
we have to keep extra eye on sensitivity which is correct classification of prediction 1
that is customer which are likely to churn
hence making sensitivity important criteria here.
Threshold Probability is final as 0.16 for the model
with ACCURACY as 77.51% (approx 78%)
with SPECIFICITY as 78.77%
with SENSITIVITY 70.10%.
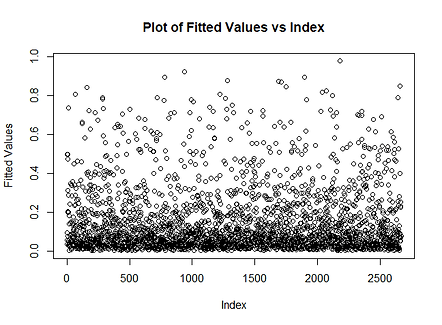
Making Prediction
We make Prediction on the final model using test churn data
GOODNESS OF MODEL
Check for multicollinearity
Variance Inflation Factor is used to check this

Variable value between 1-15 is considered fine,thus this check pass.
AUC & ROC Curve
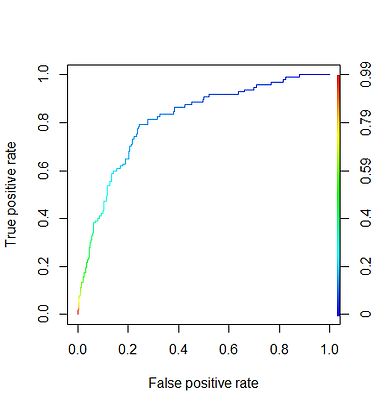
Area Under Curve (AUC) and Receiver Operating Characteristic (ROC) curve is a graphical plot that illustrates the performance of a binary classifier system as its discrimination threshold is varied. The curve is created by plotting the true positive rate (TPR)against the false positive rate (FPR)
at various threshold settings.
AUC is 81.3%,Since area under the curve value is greater than 80% hence the model is good
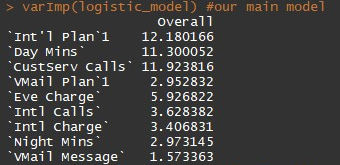
key Drivers of the model
Showing the variables which contribute more to the model